Office Occupancy
Gain insights into office occupancy and workplace trends in Chicago and peer markets with data dating back to 2017. This interactive dashboard offers a comprehensive view of occupancy patterns over time and across locations. Use the filters on the right to explore and analyze the data more effectively.
This project concluded in September 2025, and the data runs until August 31, 2025. BOMA/Chicago members may request access to the underlying dataset, including commute distances and other data not provided below, for independent analysis. Any publication or distribution derived from this dataset must include attribution to BOMA/Chicago and a BOMA/Chicago logo. Please email info@bomachicago.org to request access.
*Disclaimers and Footnotes:
- This dashboard is developed for general public interest by BOMA/Chicago from large data sets that BOMA/Chicago did not create. Neither BOMA/Chicago nor any of its affiliated individuals or entities guarantees the accuracy of this data or its suitability for any purpose. Use of this information is entirely at the user's risk.
- Office Occupancy Charts
- Occupancy is a weekly total number of visits that last 2 hours or more, derived by Placer.ai from a sample size of participating cellular telephones users traveling to each property.
- Chicago office occupancy is measured across ~200 BOMA/Chicago member buildings known by BOMA/Chicago to be offices.
- Occupancy for all other cities is derived from 800+ buildings picked by Placer.ai, and consists predominantly of the largest, Class A office buildings in each respective metro.
- Office Visits by Day of Week
- Occupancy is the daily total of all visits to the property, derived by Placer.ai from a sample size of participating cellular telephone users traveling to each property.
- Comparisons to 2019
- Comparisons to 2019 occupancy are against the closest relevant week as determined by BOMA/Chicago--e.g., occupancy for the week of Monday 3/13/2023 is measured against the week of Monday 3/11/2019.
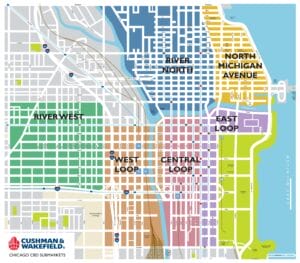
- Submarkets
- Submarkets are delineated as below: